


Site reliability engineering (SRE) used to be the remit of a single team. These SRE teams of the pre-2020s would build and operate the entire reliability stack, keeping production on track and holding sole responsibility for system health.
But SRE practices are quite different post the early 2020s inflexion point. Now, SRE and platform engineering are embedded across systems and teams, with an increasing focus not just on automation but fully autonomous, AI-driven operations.
In this piece, we:
- Re-cover the core SRE concepts for readers fresh to the topic
- Give you 9 SRE best practices updated for 2026 and beyond
- Examine common KPIs
- And some current tooling options
The what and why of SRE from its beginning to now
The old SRE
Pioneered at Google, SRE began as an approach in which a single team applied software engineering solutions to operations. In practice, this meant defining SLIs (service level indicators) and SLOs (service level objectives), using error budgets/burn rates to mediate between stability and frequency and fixing via a single team running on-call, incident response, postmortems, capacity planning, and toil-reducing automation.
The problems it solved
The old SRE professionalised, automated and quantified the old operations team problem: constant manual firefighting of issues with no framework or targets.
The new SRE
SRE followed a common pattern in tech. A discipline is defined and made a single team’s remit. This team can’t practically scale with the application. So, its principles were operationalised, automated and spread throughout product and service teams.
The problems solved today
The new site reliability engineering solves the same essential problems as the old one. How to deliver reliability at scale. The difference is in how it’s applied.
As we move on to our X practices for 2026, you will see the focus is less on tactics and strategies an individual team may apply, and more on how organisations operationalise SRE across their technology pipelines.

SRE practices for 2026
1. Standardise reliability with SLOs-as-Code
By 2026, most teams have moved past accidental reliability. You likely have dashboards and alerts, but the real change is treating reliability targets like infrastructure: versioned, reviewed, and stored in Git.
Using a declarative spec like OpenSLO, you move your SLO definitions out of proprietary UI silos and into YAML files that live alongside your source code.
When SLOs are code, they can begin to drive production. You can automatically trigger canary rollbacks, gate production deployments, and standardise burn-rate paging across hundreds of microservices without manual intervention.
2. Standardise observability with OpenTelemetry
Once reliability is shared across lots of teams, the fastest way to create chaos is letting every service emit telemetry in different ways. OpenTelemetry gives you a common, vendor-neutral way to instrument traces, metrics and logs, so you’re not rebuilding observability per team or per tool.
Pick a small set of required fields and conventions (service naming, environment tags, correlation/trace propagation) and route everything through an OpenTelemetry Collector pipeline so you can centralise sampling, filtering, redaction and export.
This consistency is what makes the rest of modern SRE work at scale.
3. Make ownership and runbooks required metadata
Shared SRE only works if it’s always obvious who owns a service and what to do when it breaks. The practical pattern is to store that information as structured metadata in a service catalogue (often via a Backstage-style model), so every component has an explicit owner, lifecycle, and links to docs/runbooks. This is kept alongside the code in YAML rather than scattered across wikis.
Further, you make that metadata usable under pressure: alerts and pages should carry a direct runbook link so the responder can go straight from problem to solution.
4. Guardrailed, auto-remediation with strict caveats
In 2026, site reliability engineering is increasingly focused on automation. However, the key is putting this kind of remediation behind guardrails: a small set of pre-approved actions the platform can take safely, like restarting a crashed workload, scaling a hot path, draining an unhealthy node or rolling back a canary.
Auto-remediation should trigger only on clear, user-impacting signals, be rate-limited, and stop after a small number of attempts to avoid masking deeper issues or causing loops. Done well, it reduces page volume and time-to-mitigate while keeping humans in control of the unknown unknowns.
SRE teams that do not show such discipline will find automation quickly compromises the system reliability it was aimed at upholding.
5. Make progressive delivery the default, with a few explicit exceptions
Progressive delivery used to be reserved for a handful of critical paths because of overhead: traffic-splitting was awkward, rollback wasn’t reliable, and teams didn’t trust the signals enough to automate.
Now, modern platforms make gradual rollouts cheap, and improved telemetry means SRE teams and development teams can be more sure of automation. So the 2026 best practice is consistency: every service ships through a staged rollout, backed by a kill switch and a proven rollback path.
That said, there are still exceptions. If you can’t safely stage the change (e.g., shared-state or high-risk data changes), don’t force canaries. Use other blast-radius controls and a rollback plan instead.
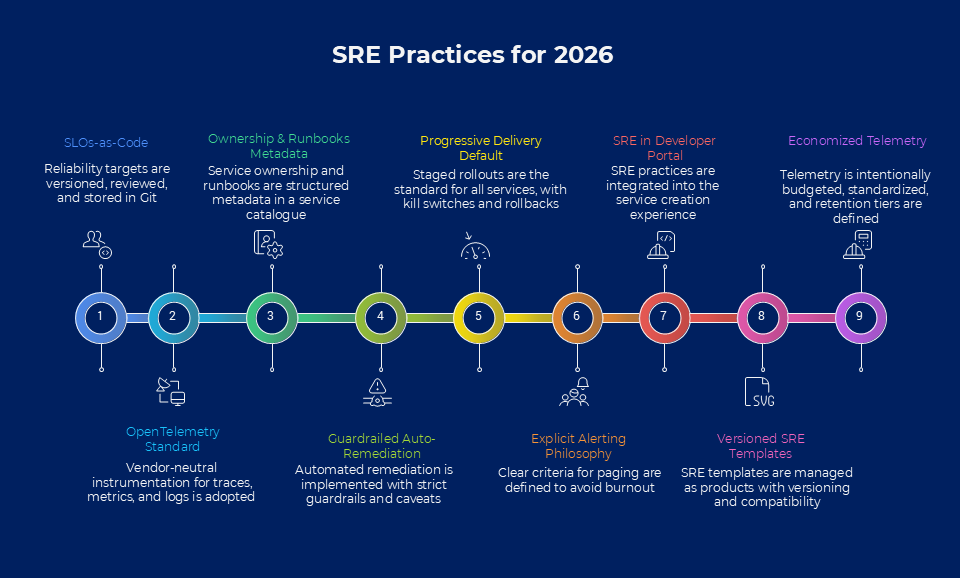
6. Standardise paging with an explicit alerting philosophy
When implementing SRE across scalable software systems, consistency is your friend. As you move up, incident management policies, especially around paging, need to be defined.
This is because over-paging is one of the fastest ways to burn out good SRE teams.
The practical best practice is to set a clear bar for what deserves a page: it should indicate active user impact (or imminent impact) and have a clear action the responder can take.
Our metadata point above becomes relevant here: our few, page-triggering incidents should be clearly marked as such, with further indicators as to owner and resolution path.
A simple framework to point to is Google’s SRE rule: only page on alerts that are urgent, important, actionable, and real. But other frameworks are available.
7. Pull it together: bake site reliability engineering into your development portal
This point ties a few of the earlier tips together.
If your organisation runs an internal developer portal, the easiest way to scale SRE is to make it part of the ‘create a service’ experience. This means many of the SRE practices discussed above appear as required inputs to your service templates and release pipelines – checked automatically before a service can ship to production.
They will include things like ownership metadata (so every service has a clear owner), a runbook stub and link, OpenTelemetry defaults (service naming, propagation, sampling/export), baseline dashboards and alert rules with paging severity tags, and starter SLO/SLI definitions in an SLOs-as-code file.
8. Manage the SRE parts of templates intelligently (versioned, compatible, and measurable)
One SRE standard has been committed to templates. Manage the templates/the SRE element like a product, not a one-off scaffold. Version them with clear release notes, keep changes backwards-compatible where possible, and ship migrations when you need to change labels/metrics so you don’t break dashboards and paging across services.
Track adoption and drift (who’s on the latest standard, who isn’t), and make upgrades simple, ideally with automated PRs that update the SRE files in each service.
9. Economise your SRE practices (give error budgets a budget)
At scale, collecting all of your key metrics gets costly, with many enterprises’ observability spends reaching the millions annually.
The 2026 move is to treat telemetry like infrastructure management: intentionally budget it, standardise it, and avoid ‘collect everything forever’ as the default.
Practically, teams do this with a few simple controls: set default trace sampling (and allow temporary ‘turn it up’ during incidents), define retention tiers (short-lived raw logs, longer-lived aggregates), and cap metric cardinality by banning or limiting high-cardinality labels like request IDs or user IDs.
Apply these rules centrally in your telemetry pipeline/collector so every service inherits them, and track which services are blowing the budget so you can fix the worst offenders first.
SRE KPIs
For development teams, operations teams, and anyone involved in the now spread-out job of ensuring system performance, understanding SRE KPIs is key.
Below is a quick summary of what your monitoring tools/observability tools will be picking up, and how they indicate system health.
Get these metrics in the green, and your service level agreement should follow the lead.

Site reliability and business objectives
As we saw in our final point, mature SRE teams (or broader business functions) do more than just software reliability: they enable teams across the business, including in the boardroom, to determine business outcomes from key metrics.
- Cost of downtime: The calculated revenue lost per unit of time during a service outage based on historical transaction averages.
- Customer impact score: A weighted measurement of the total number of users affected by an incident multiplied by the business criticality of the failed function.
- SLA compliance rate: The percentage of time the service met its contractual uptime obligations to avoid financial penalties or service credits.
- Innovation velocity: The percentage of total engineering capacity dedicated to building new features rather than performing manual operational toil.
- Reliability ROI: The financial return calculated by comparing the cost of stability investments against the estimated revenue loss prevented by those improvements.
Key metrics for production systems (service quality)
These are core service quality metrics: they determine user satisfaction and whether or not you need to take action.
- SLO attainment: Success rate over a rolling window (e.g., 28 days).
- User error rate: % of requests that fail for users (per critical journey).
- Tail latency (p95/p99): The experience of your most frustrated users. At scale, the average latency is a lie; the p99 is the truth.
- Dependency SLOs: Tracking how much of your unreliability is actually caused by 3rd-party vendors (e.g., AWS, Stripe, Twilio).
Error budgets
The formal contract between product and engineering that dictates the pace of innovation.
- Error budget remaining: The allowed unreliability left (100\% – SLO).
- Burn rate: The speed at which the error budget is being consumed relative to the SLO, where a rate >1 indicates the budget will be exhausted before the window ends.
Incident management & response
Focusing on the quality and speed of recovery, rather than just the count of failures.
- p95 Time to mitigate (TTM): How long it takes to restore service for the vast majority of incidents. (Avoid mean times, as outliers skew the data).
- Time to detect (TTD): The gap between user impact and system awareness.
- Toil rate: The amount of interrupt-driven manual work. If SREs spend >50\% of their time on tickets vs. engineering, the system is unsustainable.
- Repeat incident rate: A measure of post-mortem effectiveness. If the same failure mode returns, the action items weren’t actually solutions.
Capacity planning & efficiency
In 2026, SRE isn’t just about keeping the lights on; it’s about keeping them on efficiently.
- Saturation & headroom: Identifying the bottleneck (CPU, i/IO, or DB connections) before it throttles the user.
- Cost of goods sold (COGS) per request: Measuring if your scale is getting cheaper as it grows.
- Provisioned vs. utilised: Identifying zombie infrastructure where you are paying for resources you aren’t using.
Continuous improvement
The feedback loop that ensures the software engineering team is getting better, not just busier.
- Action closure rate: The speed at which high-priority items from post-mortems are actually moved to production.
- Reliability trend: A macro-view—is the system becoming more resilient over a 6-month period, or are you just getting better at firefighting?
SRE tooling
In our final section, we look at some common tools to help you achieve the practices already covered.

OpenSLO
An open, declarative YAML spec for service level objectives (and, by extension, defining service level indicators) as code. It gives teams a portable way to store SLO definitions in Git, which tools and pipelines can use for error-budget reporting and release checks.
OpenTelemetry
A vendor-neutral observability framework for collecting the three core signals—traces, metrics, and logs—so teams can measure customer experience, service availability, and system health consistently across production systems. It’s the standard wiring that makes your key metrics comparable across services.
Backstage
An internal developer portal built around a software catalogue and templates. In an SRE approach, it’s where you encode ownership/runbooks and provide create-a-service templates so development and operations teams don’t repeat the same operations tasks for every new service.
Argo Rollouts
A Kubernetes progressive delivery controller that supports canary and blue/green strategies. It’s how you make releases safer by default—gradual rollouts, automated analysis, and rollback—so you improve service reliability without slowing feature delivery.
Prometheus
A widely-used monitoring system for metrics collection and alerting. It underpins many monitoring tools setups and is commonly used to track system performance and reliability signals (errors/latency/saturation).
Grafana
A dashboard layer that turns metrics into operational views, useful for quickly visualising service quality, investigating regressions, and supporting continuous improvement reviews.
Loki / Tempo
Tools for logs. They’re typically used during incident response to connect what users saw to the failing dependency or code path, speeding diagnosis in scalable software systems.
PagerDuty / Opsgenie
Both are incident management/incident response tools: paging, escalations, schedules, and coordination. In practice, they enforce your paging philosophy, so on-call stays sustainable as site reliability responsibilities spread.
Terraform
Infrastructure as code for repeatable infrastructure management. Terraform helps detect/manage configuration drift and helps SRE teams standardise environments, which is a big lever for maintaining system reliability.
LaunchDarkly
This tool feature flags/management tool, useful for kill switches to reduce blast radius: turn off risky behaviour quickly without a redeploy, and support safer rollouts for new feature development.
How we can we help
At Just After Midnight, we’ve helped countless brands achieve their goal of safe and reliable software delivery.
Whether through our managed cloud services, our trailblazing 24/7 support or DevOps services.
To find out how we could help you with your SRE, system stability, or anything else, just get in touch.